Sweep Analysis
Parameter Configuration
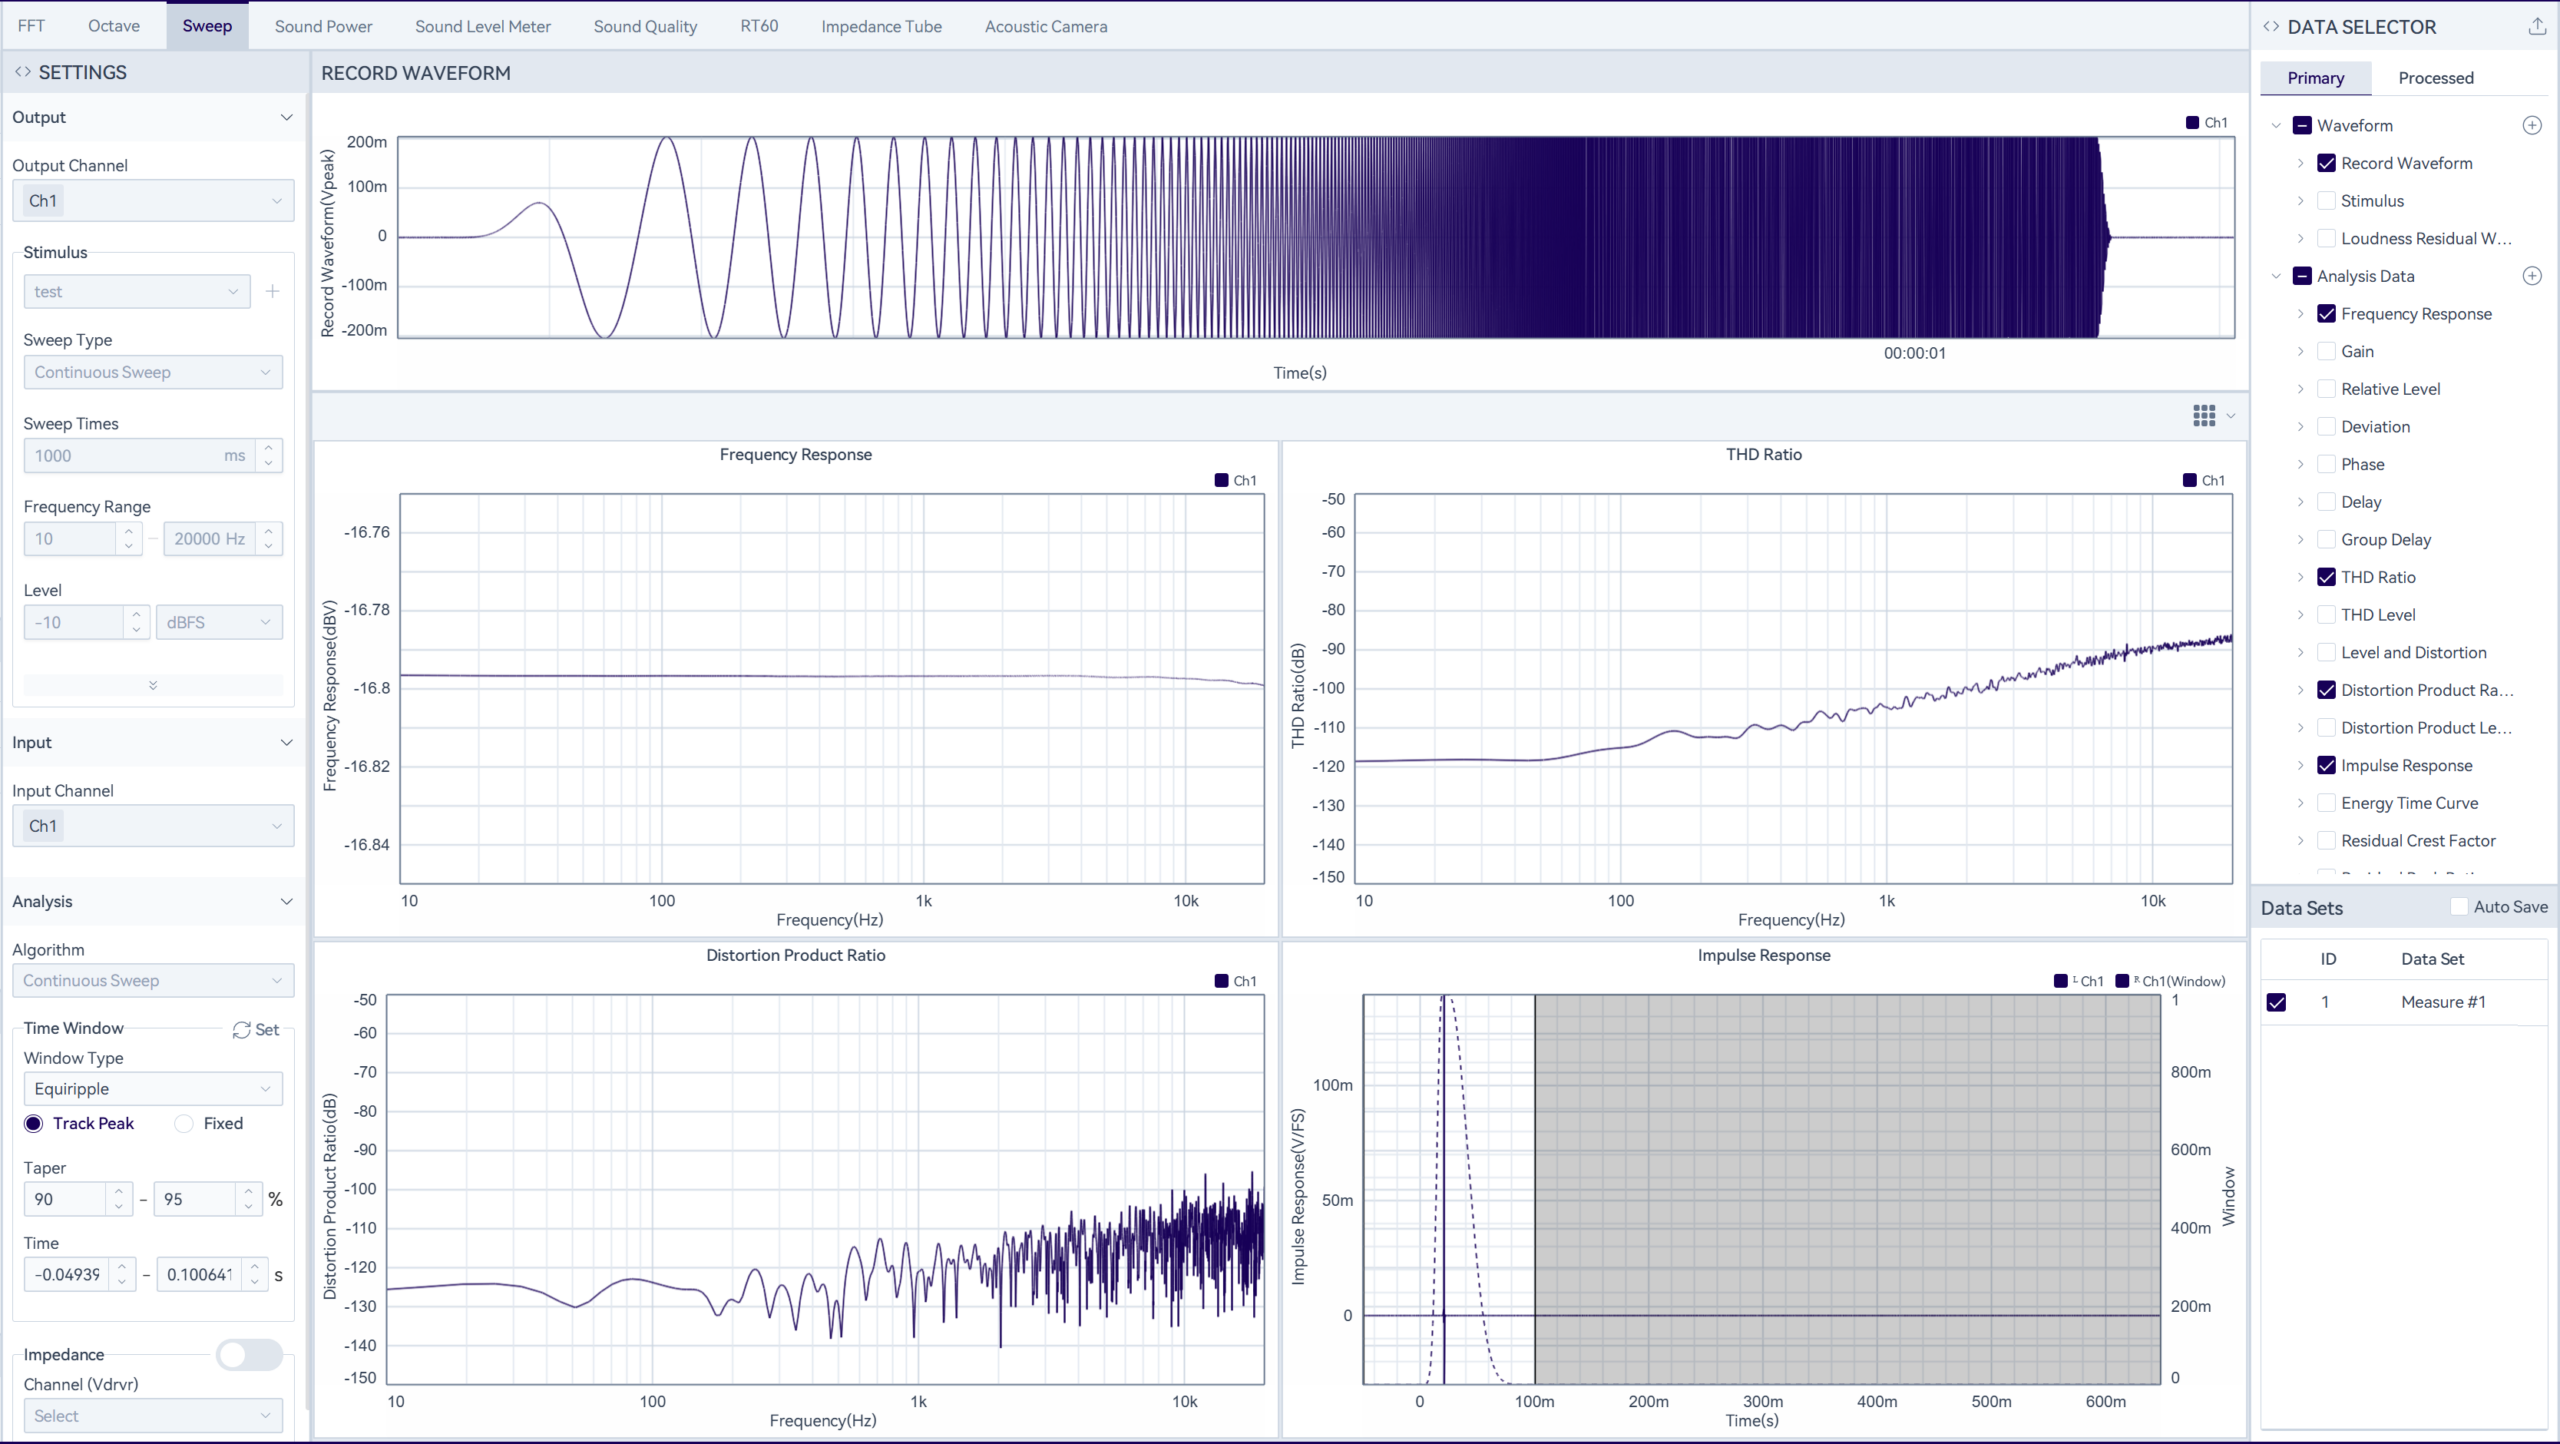
Configure test parameters in the settings panel, including output channels, excitation parameters, input channels, and time-window parameters.
By selecting different excitation types, you can perform continuous sweep analysis and stepped sweep analysis. Stepped sweep requires authorization to use.
After the test is completed, you can adjust the time window and recalculate. You can drag the mask in the impulse response plot, or edit the values in the settings panel. After making changes, click "![]() " to apply.
" to apply.
Measure & Analysis
Click on the "![]() " icon in the function bar, and the system will perform the acquisition action according to the sweep time. After the analysis is completed, or manually clicking the "
" icon in the function bar, and the system will perform the acquisition action according to the sweep time. After the analysis is completed, or manually clicking the "![]() " icon to end the test.
" icon to end the test.
Data Viewer
After each measurement, previous records are deleted by default. To keep records, select "Auto Save" in Data Sets before starting the measurement. Once enabled, test data will be kept automatically after each run. If you deselect it again, historical data will be deleted during the next measurement.
Select any measurement record in Data Sets and click the "![]() " icon on the toolbar to play back the data. With the "
" icon on the toolbar to play back the data. With the "![]() " icon on the right side of the Acquired Waveforms panel, you can listen to the waveform. When multiple records are selected, you can view overlaid data, but simultaneous listening is not supported.
" icon on the right side of the Acquired Waveforms panel, you can listen to the waveform. When multiple records are selected, you can view overlaid data, but simultaneous listening is not supported.
The data displayed in the chart area can be switched by selecting/deselecting analysis results in the Data Selector to replace the data you want to view. Click the "![]() " icon to adjust the layout per screen, supporting up to a 10×10 grid layout. To adjust the data for a specific chart, click the chart to highlight it, then select the data in the Data Selector to apply the change.
" icon to adjust the layout per screen, supporting up to a 10×10 grid layout. To adjust the data for a specific chart, click the chart to highlight it, then select the data in the Data Selector to apply the change.
Data Saving
Click the "![]() " icon in the upper right corner of the "Data Selector" to save data. The software supports waveform export and analysis data export, with support for the .wav/.csv/.h5 formats.
" icon in the upper right corner of the "Data Selector" to save data. The software supports waveform export and analysis data export, with support for the .wav/.csv/.h5 formats.
Report Generation
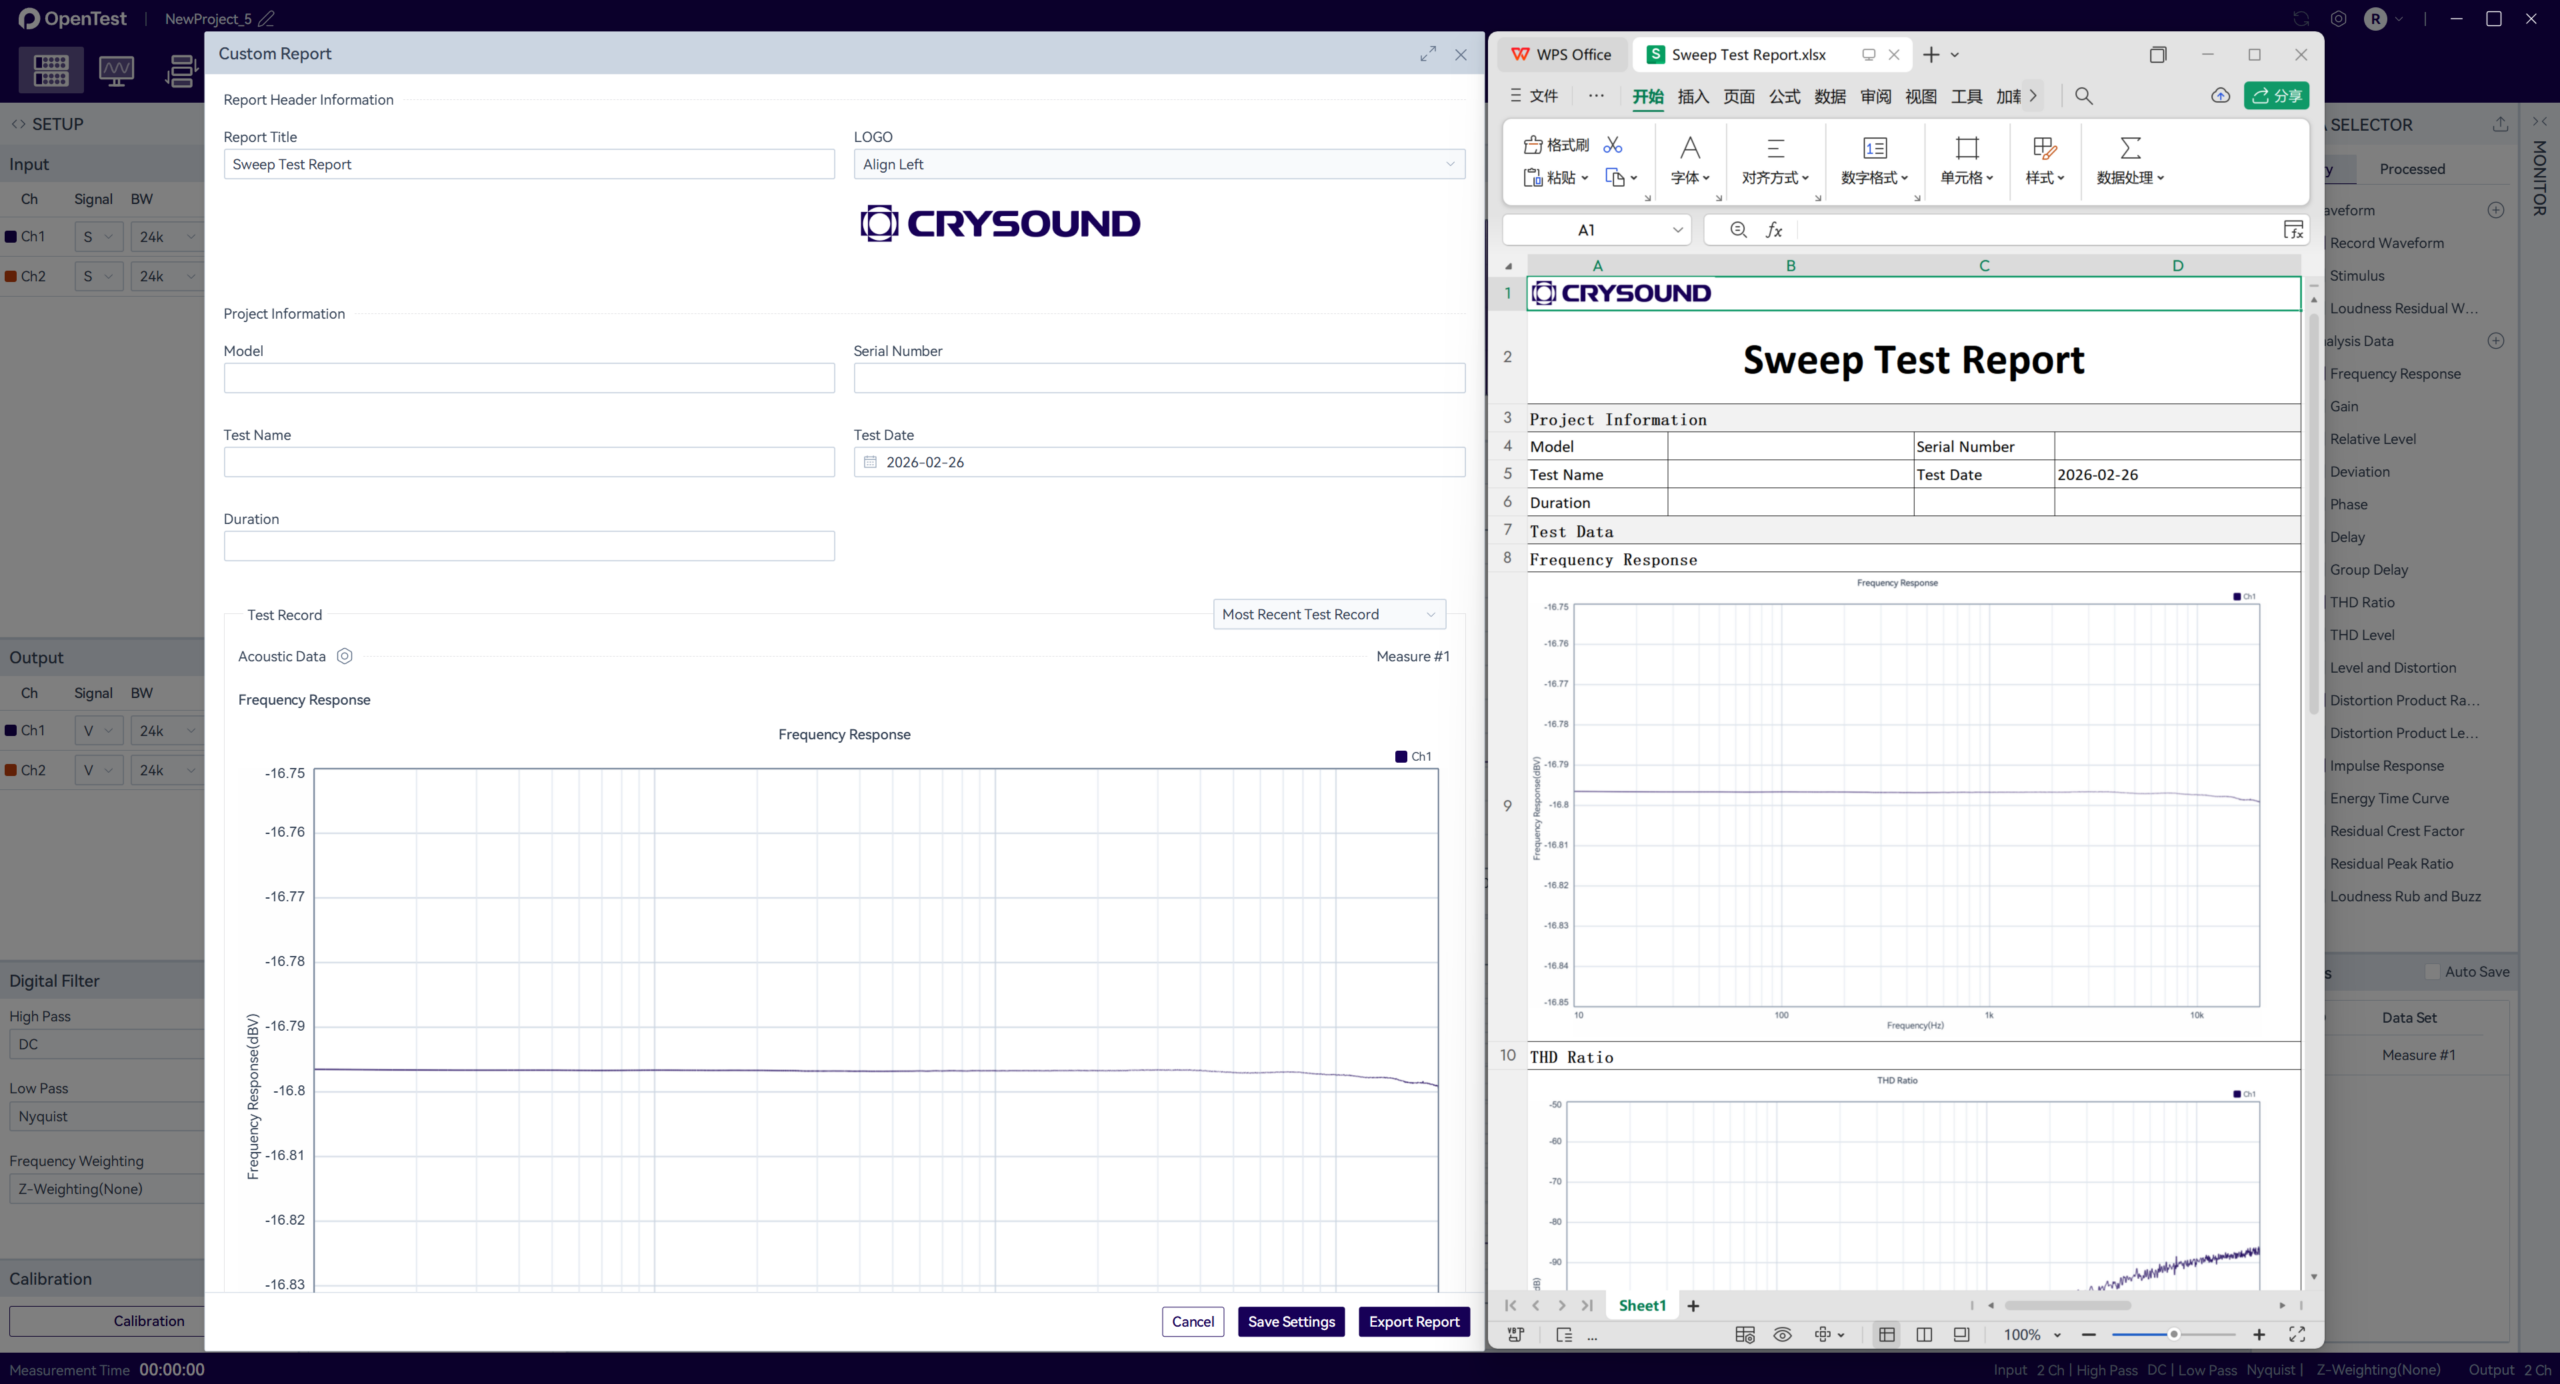
Click the "Report" button in the function bar to open the custom report configuration popup window.
Then fill in the device information and test description, and select a test record(the most recent test record is selected by default; you can switch to specify a specific one). Click the"![]() "icon to modify the data tables and images displayed in the report. Click the "Export Report" button to download the Excel file.
"icon to modify the data tables and images displayed in the report. Click the "Export Report" button to download the Excel file.