Sound Quality
Parameter Configuration
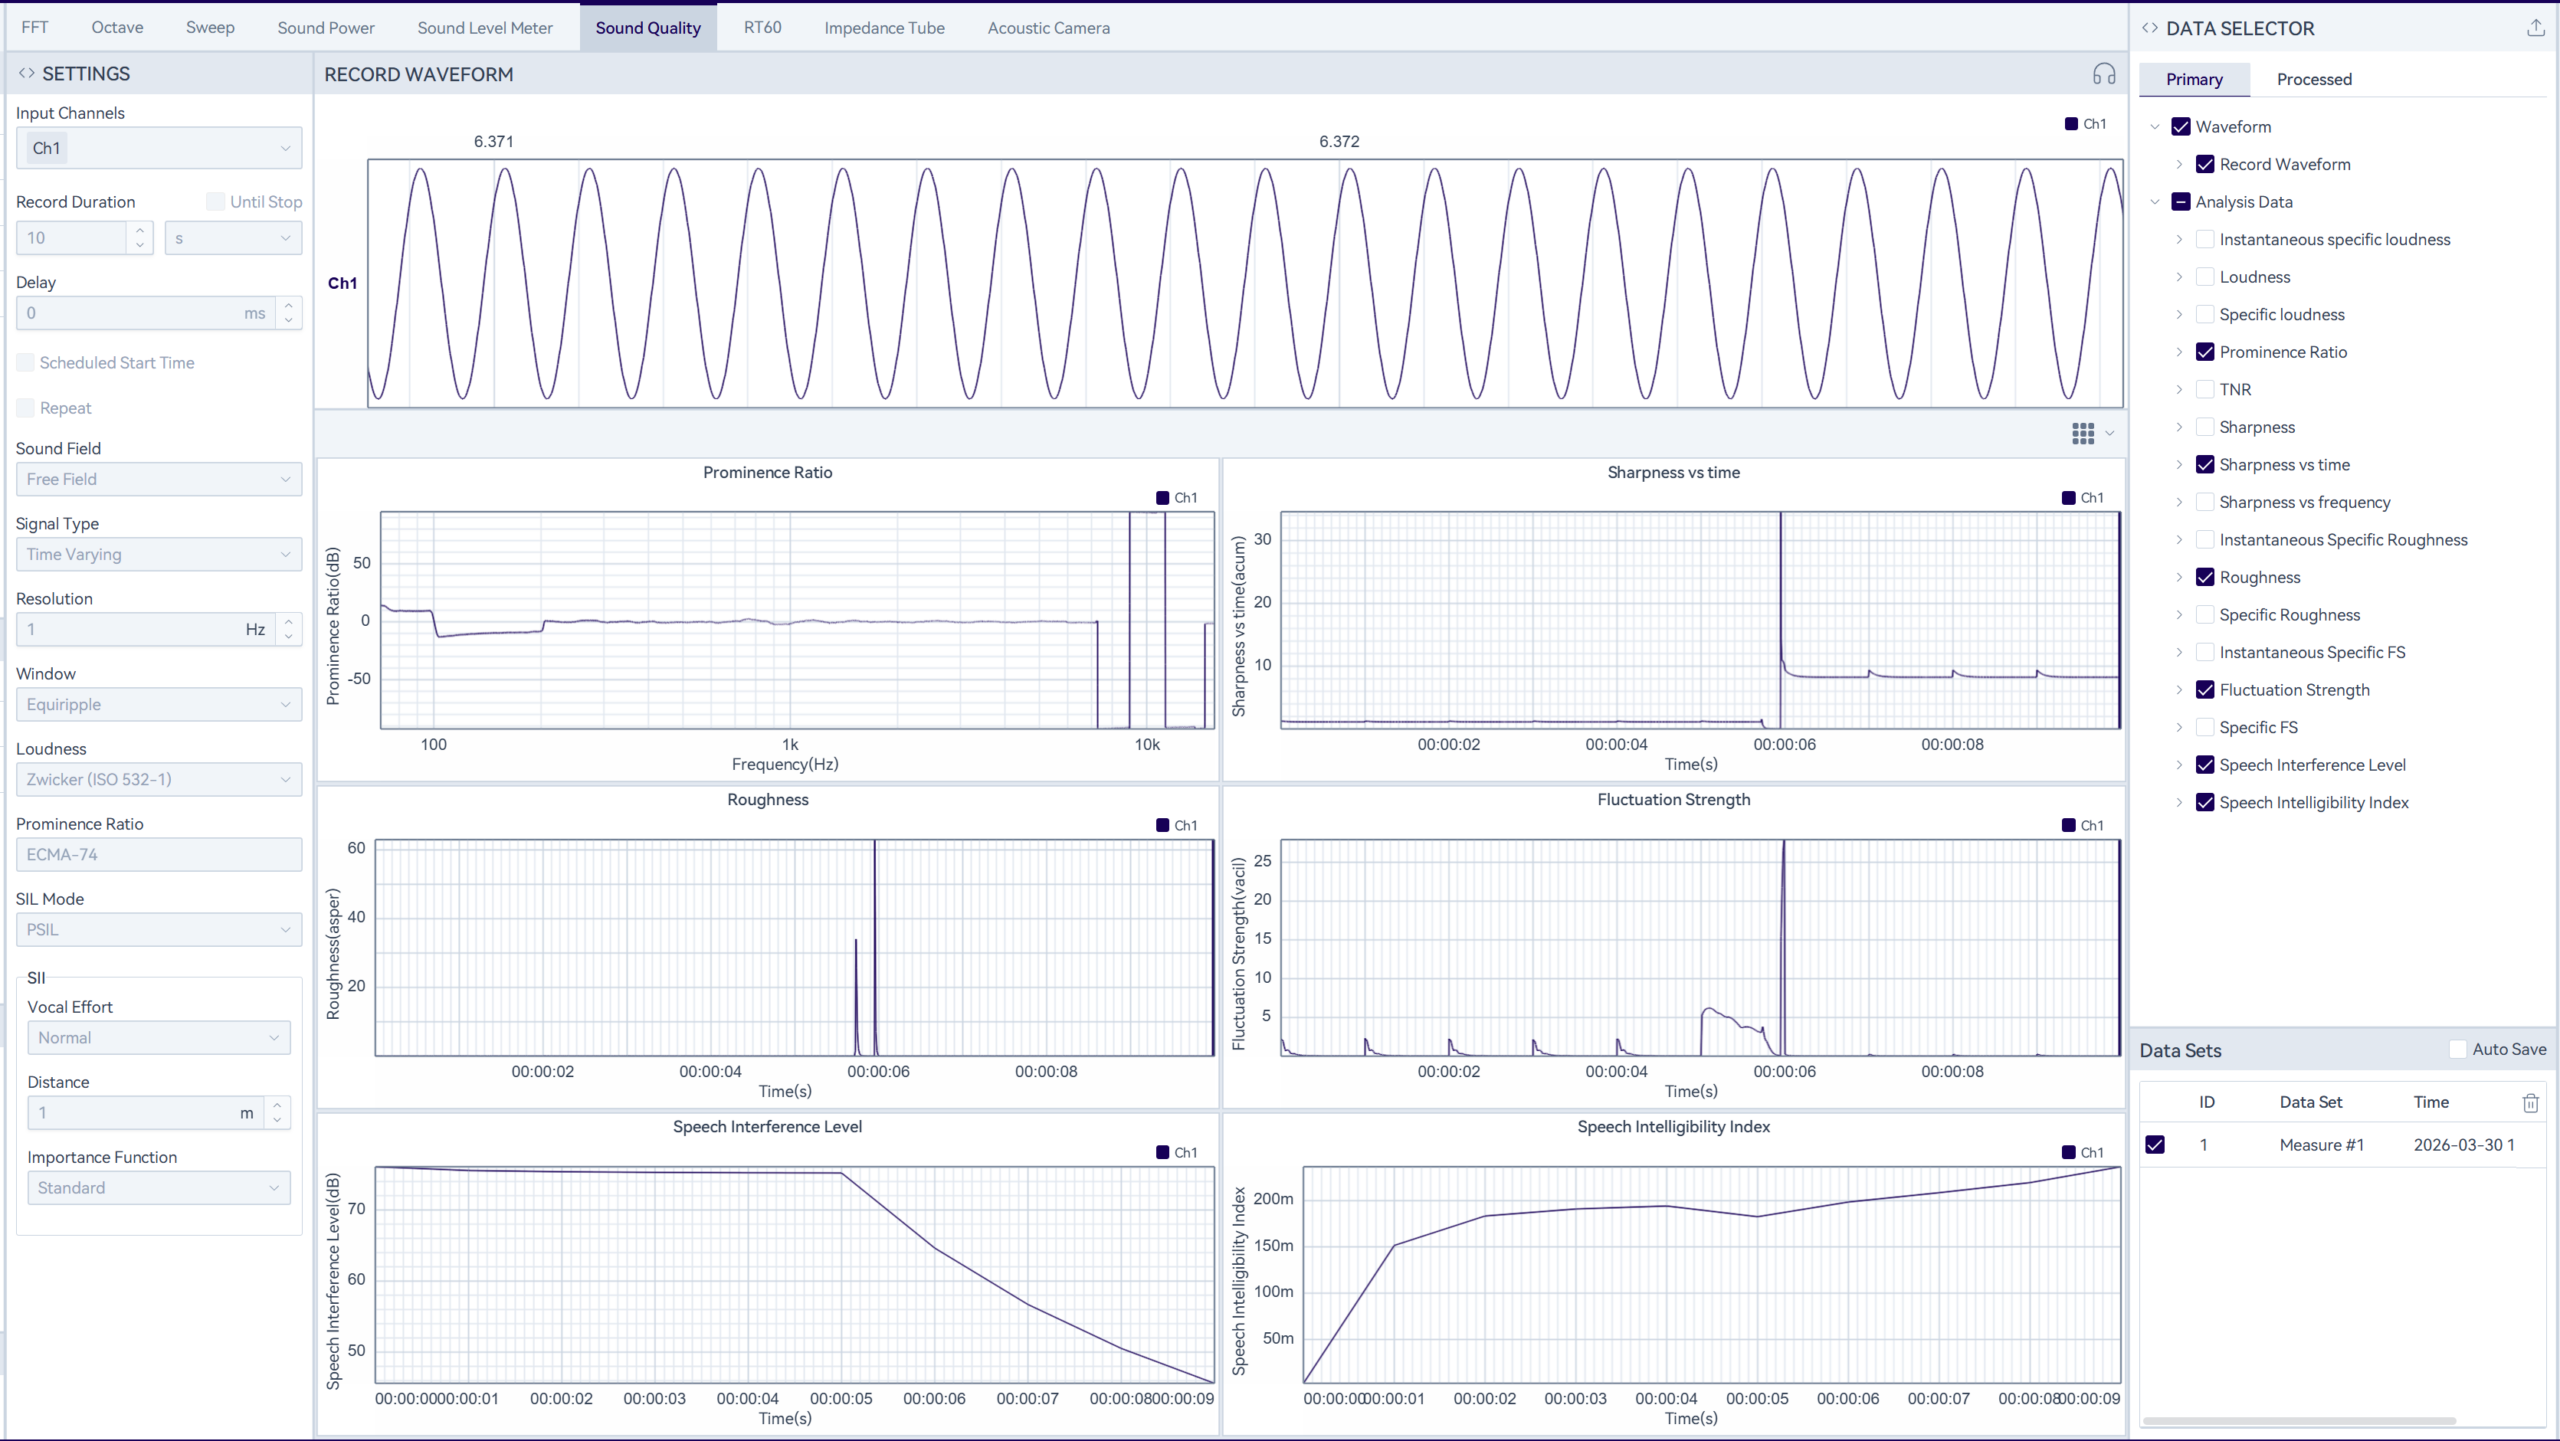
Configure the test parameters in the settings panel, including selecting input channels and setting acquisition time, sound field type, resolution, window function, SIL parameters, SII parameters, etc. Parameter changes will take effect the next time the test is executed.
Sound quality analysis supports loudness, sharpness, roughness, and fluctuation strength analysis, as well as TNR, PR, SIL, and SII analysis.
Measure & Analysis
Click on the "![]() " icon in the function bar, and the system will perform the acquisition action according to the set acquisition time. During the acquisition process, analysis will be performed in real time. The test can be ended either when the configured time is reached or by manually clicking the "
" icon in the function bar, and the system will perform the acquisition action according to the set acquisition time. During the acquisition process, analysis will be performed in real time. The test can be ended either when the configured time is reached or by manually clicking the "![]() " icon.
" icon.
When the sampling rate is not 48 kHz, the software will automatically resample it to 48 kHz before analysis.
Continuous Measurement:
Select "Until Stopped" and the acquisition time will no longer take effect. After the test starts, you must click Stop manually to end it. If storage space becomes insufficient during the test, the protection mechanism will also automatically stop the test.
Scheduled Measurement:
Check "Scheduled Start" to automatically start the test at a specified time. For example, set the start time to 08:00:00, the acquisition time to 12 h, and repeat 3 times. After clicking Start, as long as the software interface remains on the current page, the test will start for 12 h at 08:00:00 each time, and will stop automatically after 3 repeats.
Repeat Measurement:
When repeat recording is enabled during non-scheduled measurement, you can set the number of repeats and the interval; when enabled during scheduled measurement, only the number of repeats can be set. For example, set the acquisition time to 10 s, repeats to 5, and the test interval to 1 s. After clicking Start, the first run begins immediately. After 10 s ends, it repeats 4 more times in the pattern: 1 s interval → 10 s acquisition.
Data Viewer
After each measurement, previous records are deleted by default. To keep records, select "Auto Save" in Data Sets before starting the measurement. Once enabled, test data will be kept automatically after each run. If you deselect it again, historical data will be deleted during the next measurement.
Select any measurement record in Data Sets and click the "![]() " icon on the toolbar to play back the data. With the "
" icon on the toolbar to play back the data. With the "![]() " icon on the right side of the Acquired Waveforms panel, you can listen to the waveform. When multiple records are selected, you can view overlaid data, but simultaneous listening is not supported.
" icon on the right side of the Acquired Waveforms panel, you can listen to the waveform. When multiple records are selected, you can view overlaid data, but simultaneous listening is not supported.
The data displayed in the chart area can be switched by selecting/deselecting analysis results in the Data Selector to replace the data you want to view. Click the "![]() " icon to adjust the layout per screen, supporting up to a 10×10 grid layout. To adjust the data for a specific chart, click the chart to highlight it, then select the data in the Data Selector to apply the change.
" icon to adjust the layout per screen, supporting up to a 10×10 grid layout. To adjust the data for a specific chart, click the chart to highlight it, then select the data in the Data Selector to apply the change.
Data Saving
Click the "![]() " icon in the upper right corner of the "Data Selector" to save data. The software supports waveform export and analysis data export, with support for the .wav/.csv/.h5 formats.
" icon in the upper right corner of the "Data Selector" to save data. The software supports waveform export and analysis data export, with support for the .wav/.csv/.h5 formats.
Report Generation
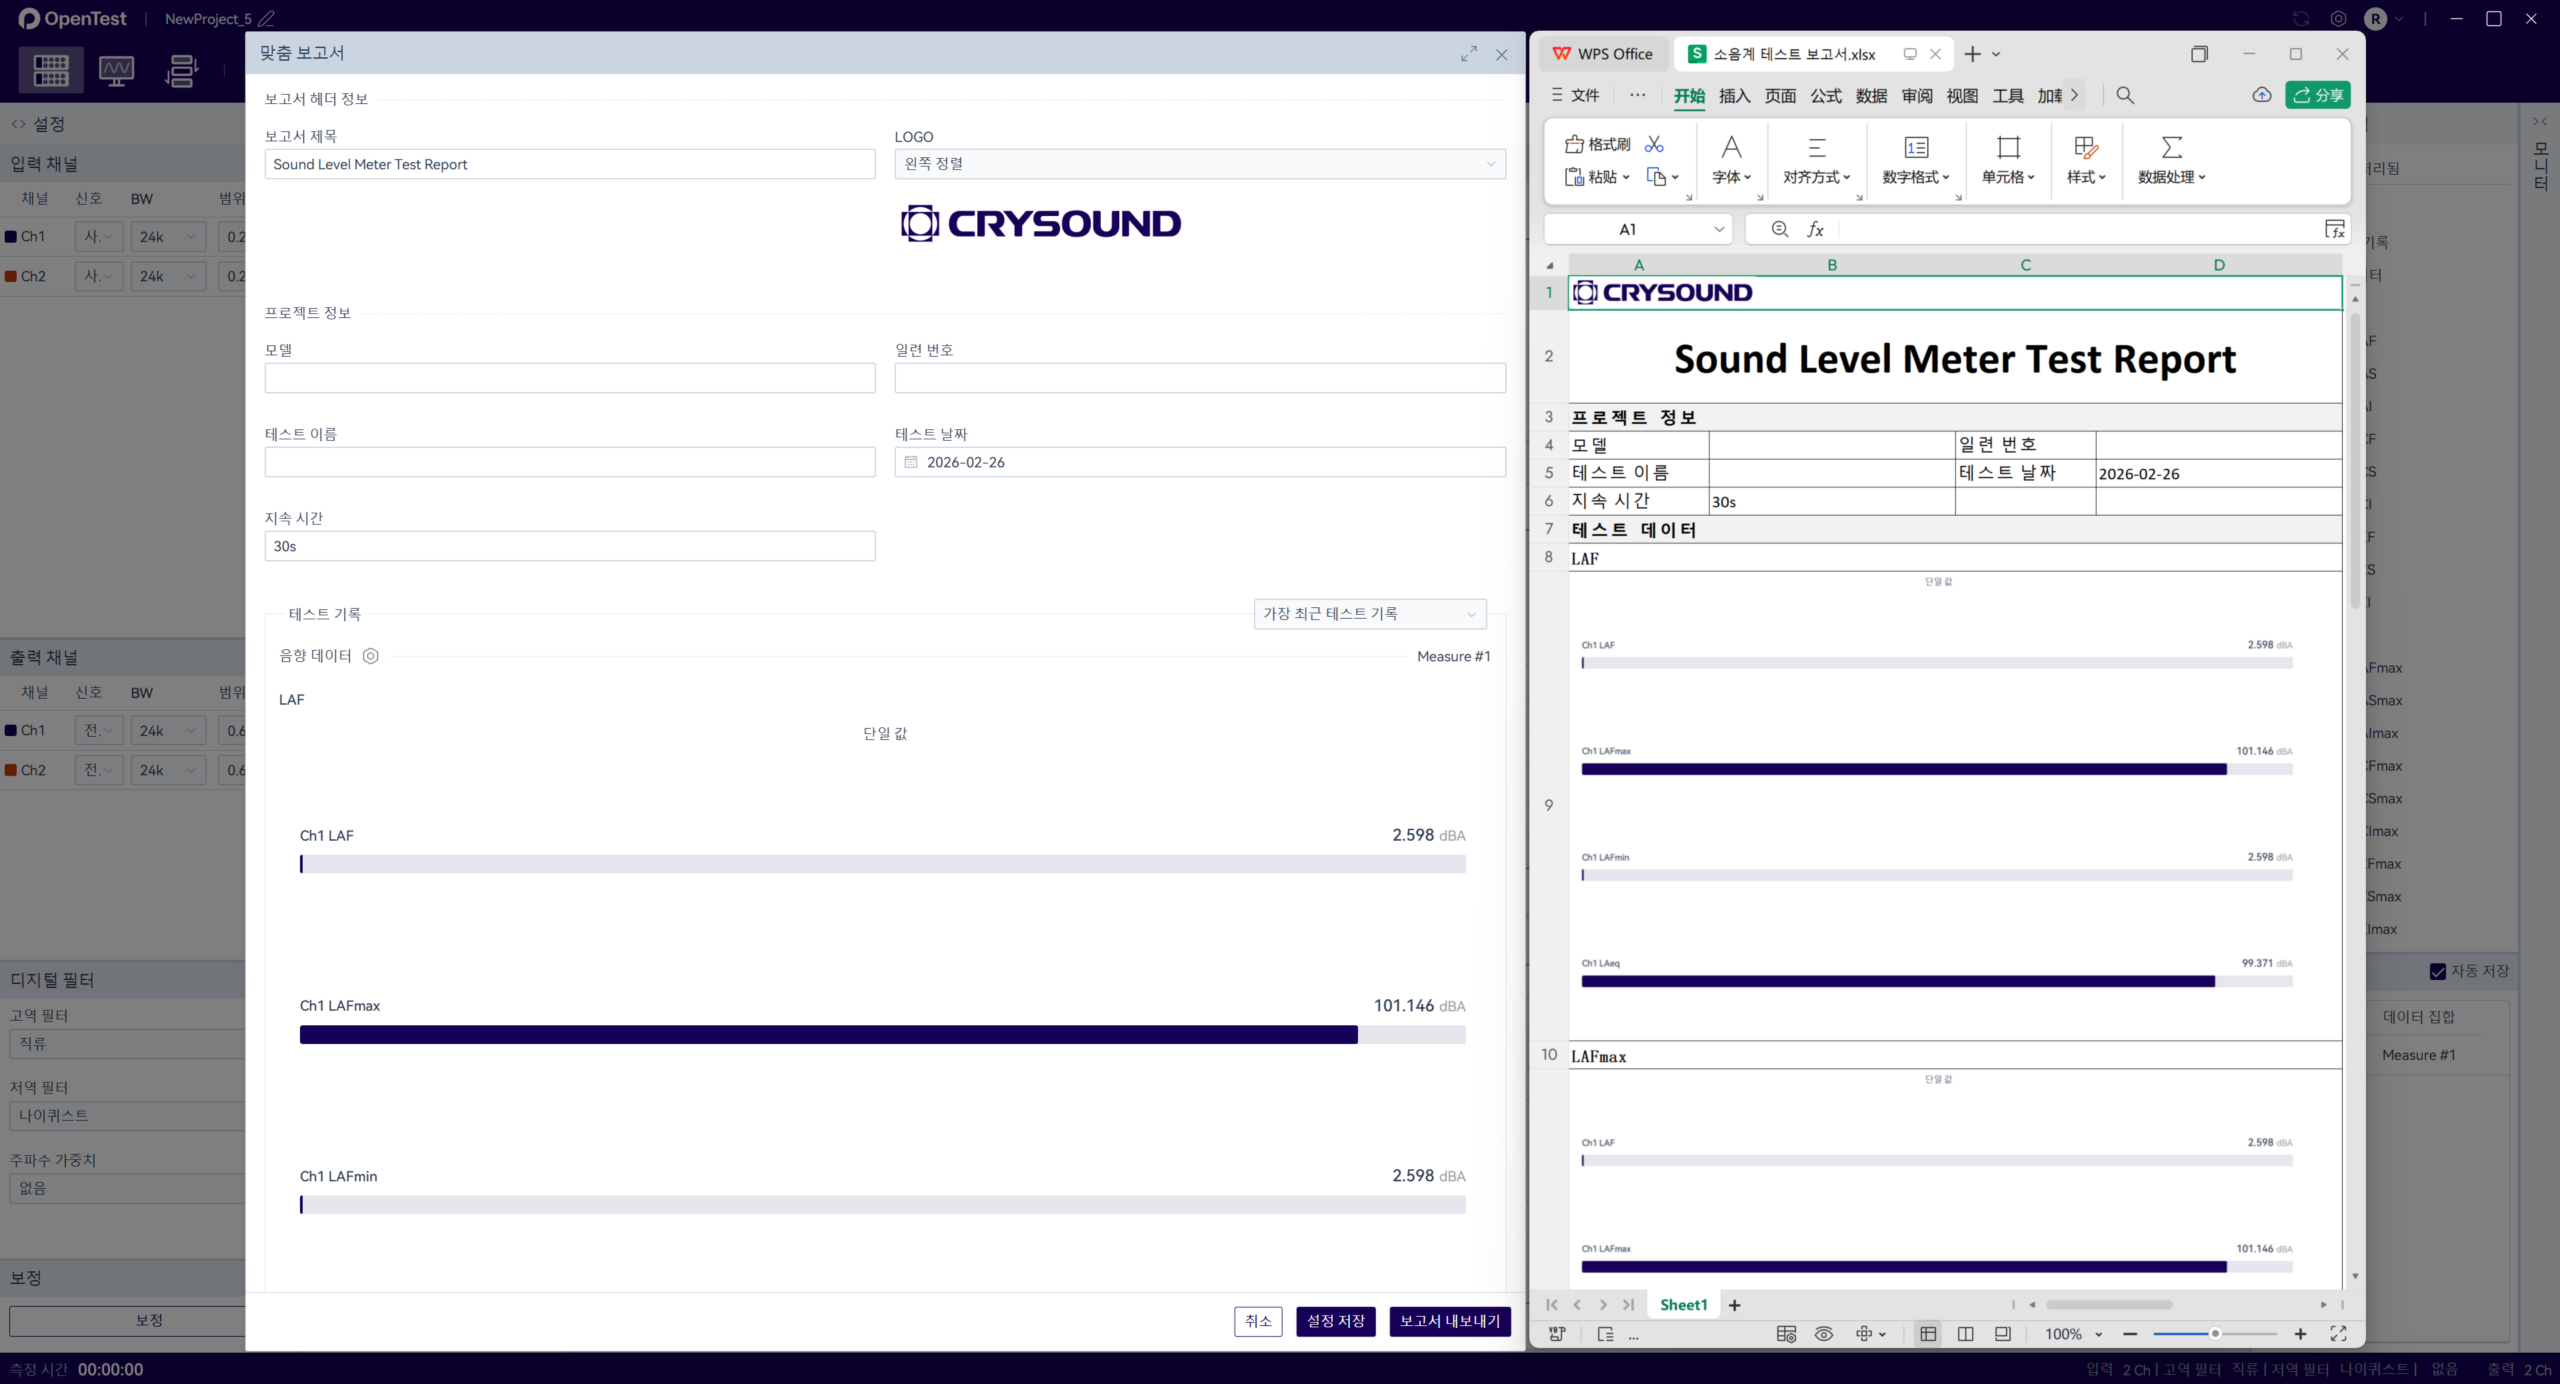
Click the "Report" button in the function bar to open the custom report configuration popup window.
Then fill in the device information and test description, and select a test record(the most recent test record is selected by default; you can switch to specify a specific one). Click the"![]() "icon to modify the data tables and images displayed in the report. Click the "Export Report" button to download the Excel file.
"icon to modify the data tables and images displayed in the report. Click the "Export Report" button to download the Excel file.